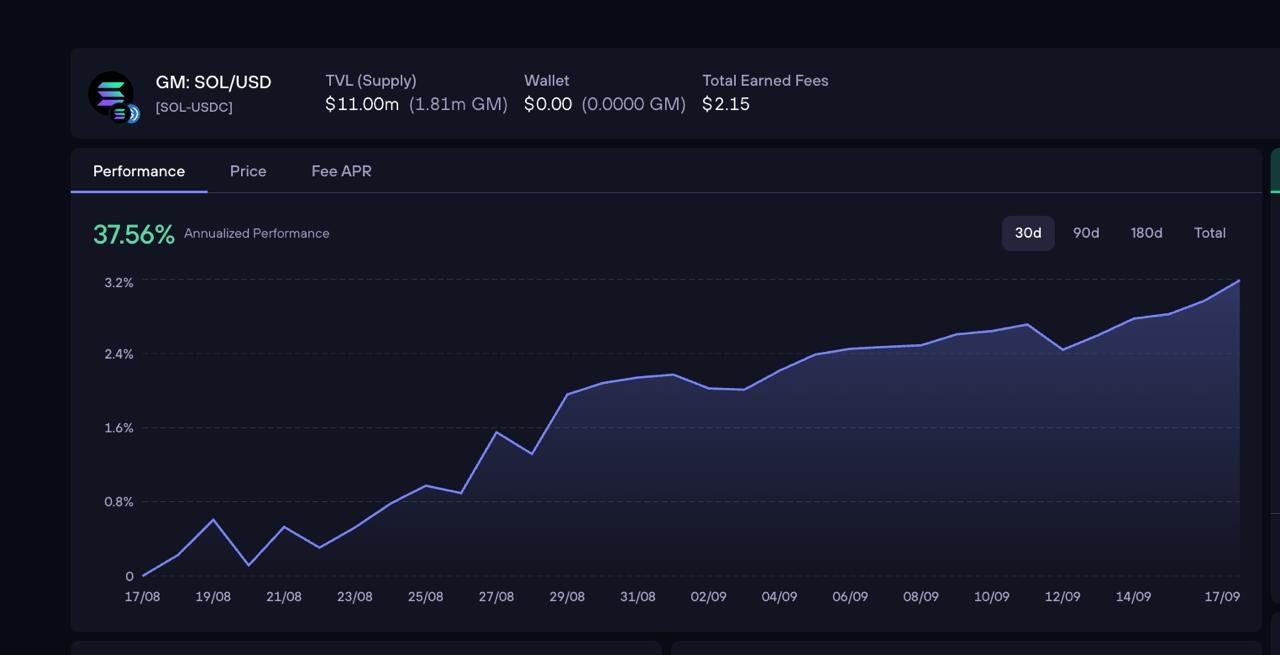
Yield seekers in DeFi are always on the hunt for that sweet spot where risk and reward align. On Arbitrum, GMX V2 liquidity pools have quickly become a favorite for those who want real yield without sacrificing flexibility. Right now, the SOL/USD pool is making waves, with a Total Value Locked (TVL) of $7,900,000 and an impressive 30-day APY of 26.1%. But what’s really driving these returns? Let’s break down the mechanics and strategies that set this pool apart.
SOL/USD Pool on Arbitrum: Real Yield in Action
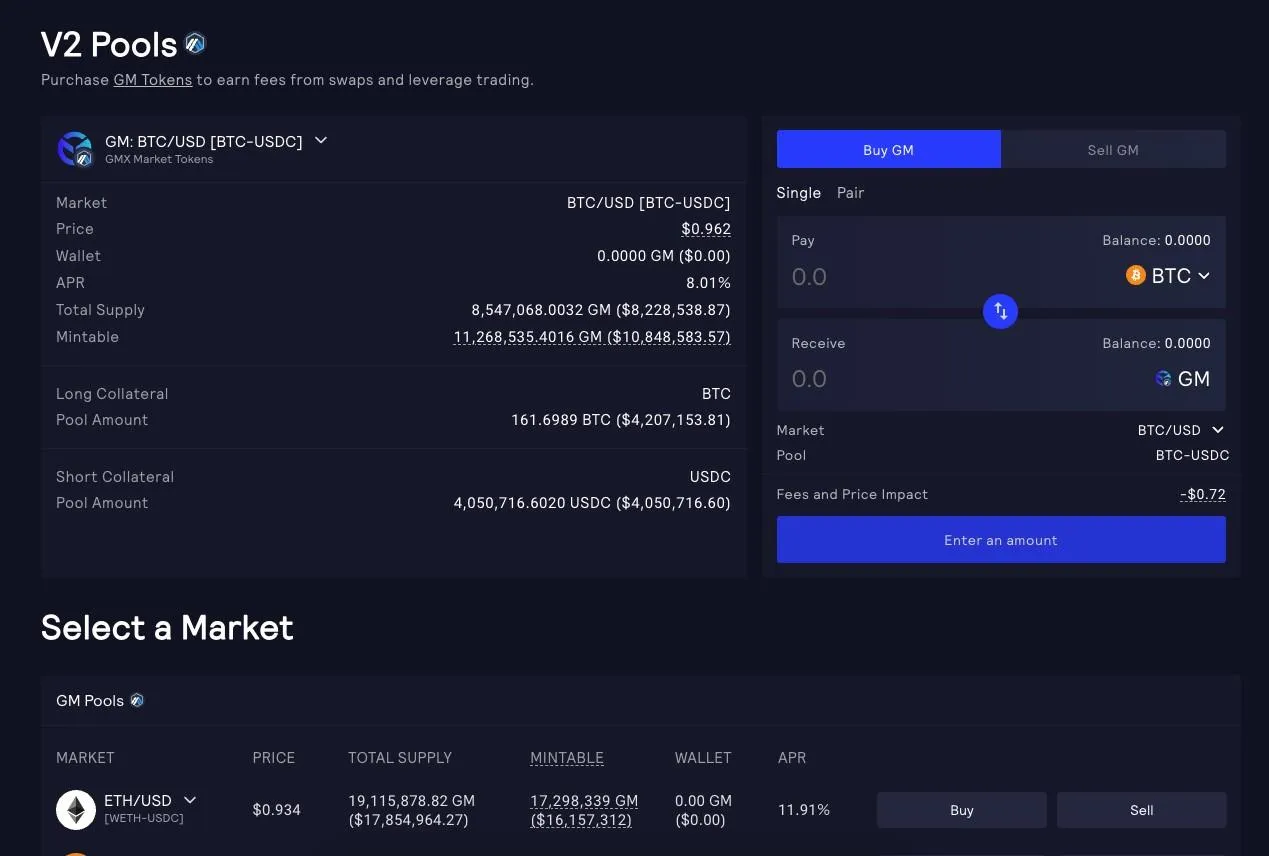
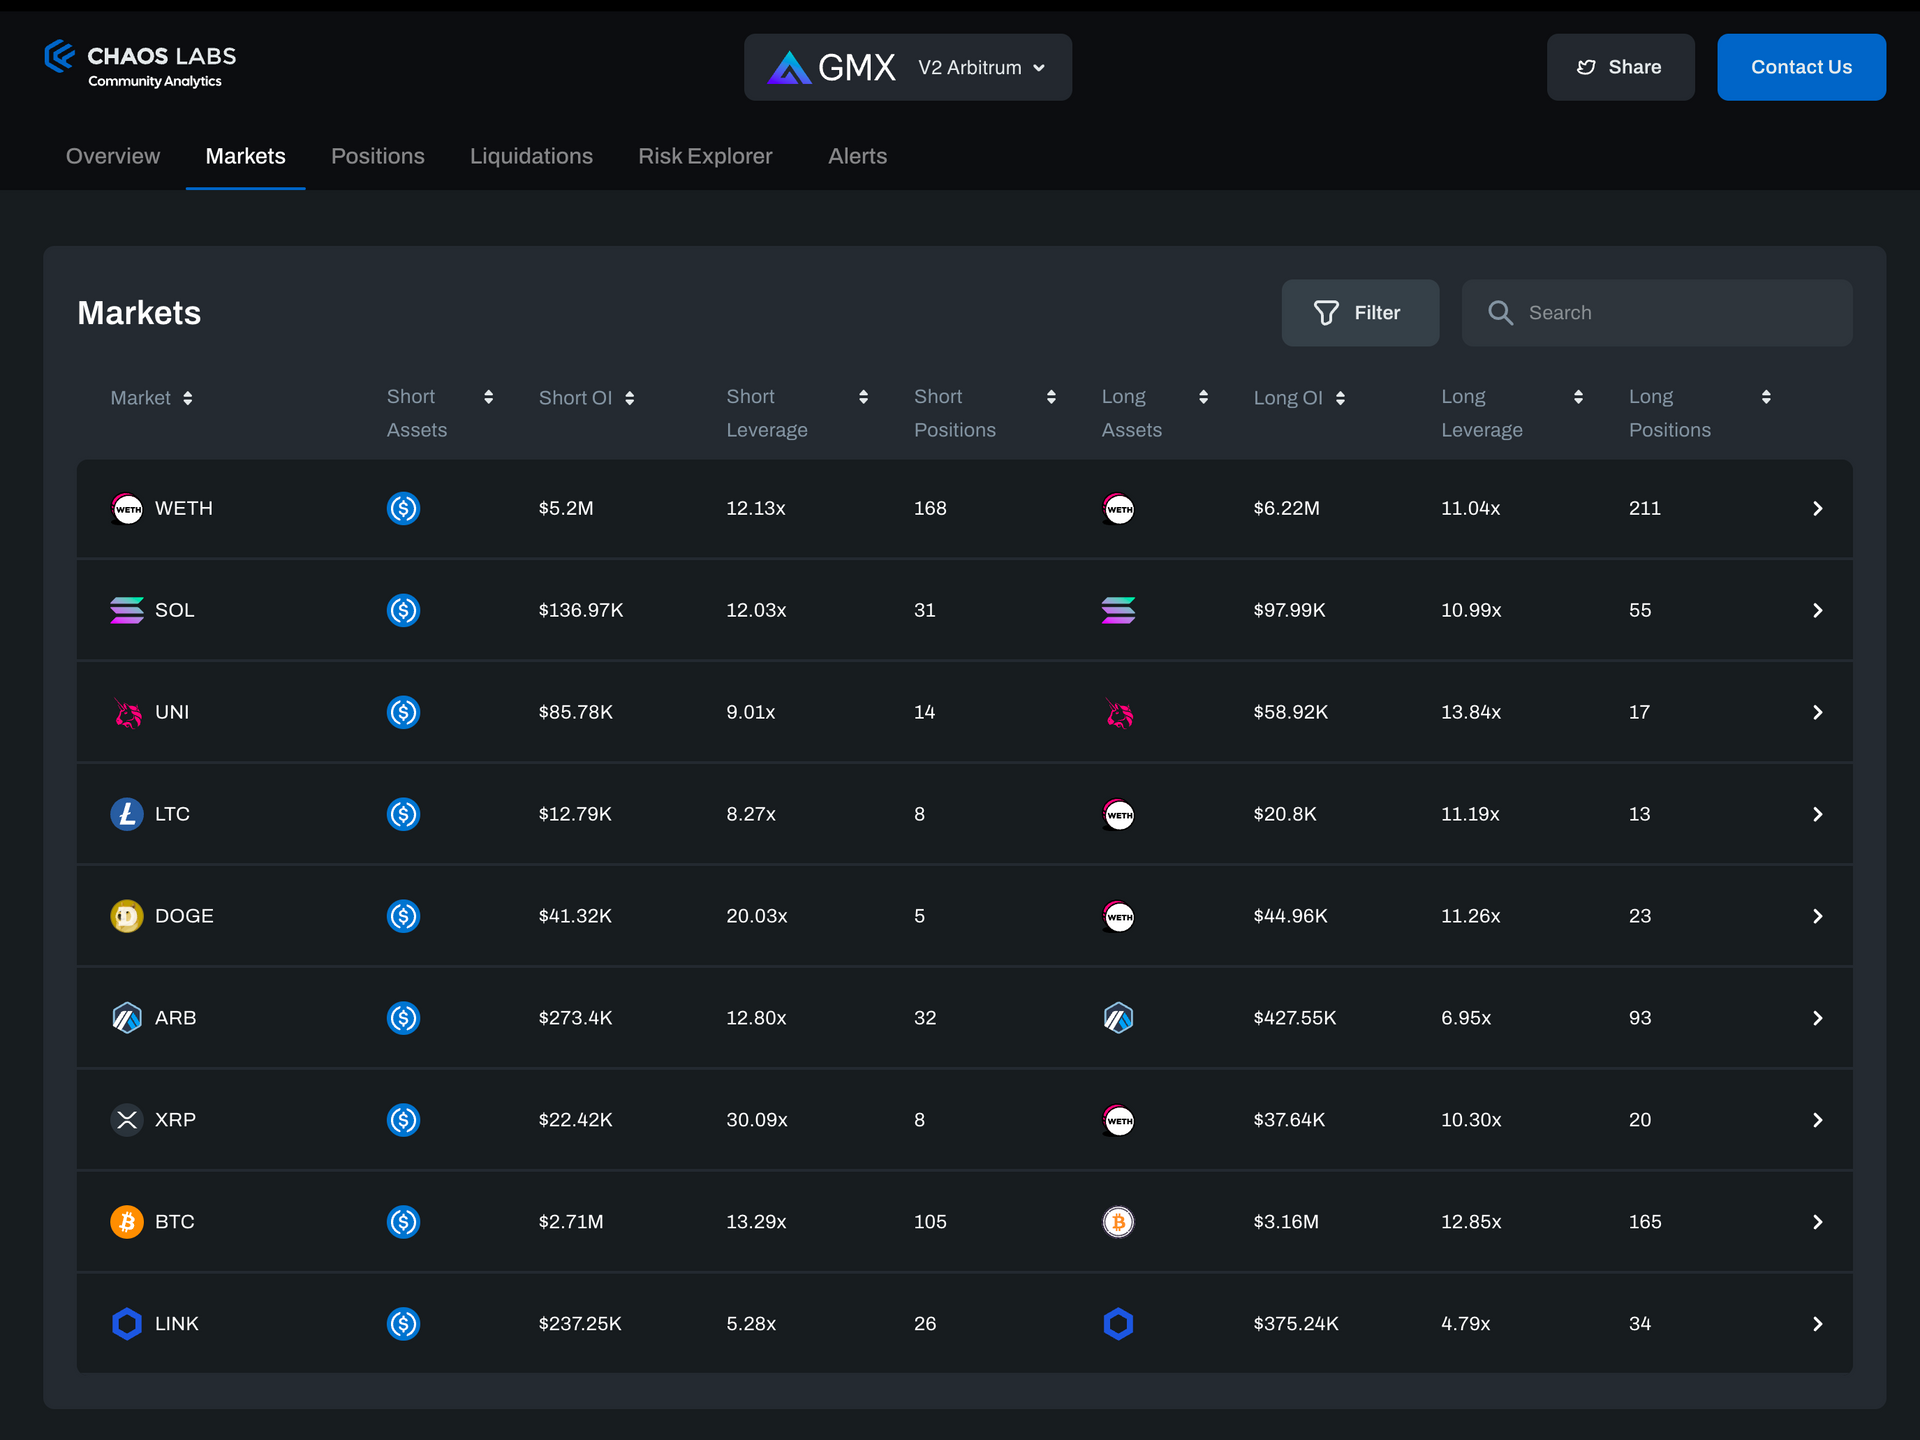
The SOL/USD pool on GMX V2 isn’t your typical AMM setup. Here, you’re providing liquidity to a market where traders can go long or short with leverage - and as an LP, you’re earning a cut of all trading and liquidation fees. In fact, GMX distributes 63% of all fees directly to liquidity providers, making it one of the most lucrative models in Arbitrum DeFi yield farming.
What makes this pool unique is its structure: SOL acts as the long token while USDC serves as the short side. This means your yield isn’t just about swap fees - it’s also tied to trader activity, funding rates, and even borrowing demand. When traders pile into leveraged positions (especially during volatile periods), fee generation spikes, directly boosting LP returns.
How Adaptive Funding Rates Drive Predictable Returns
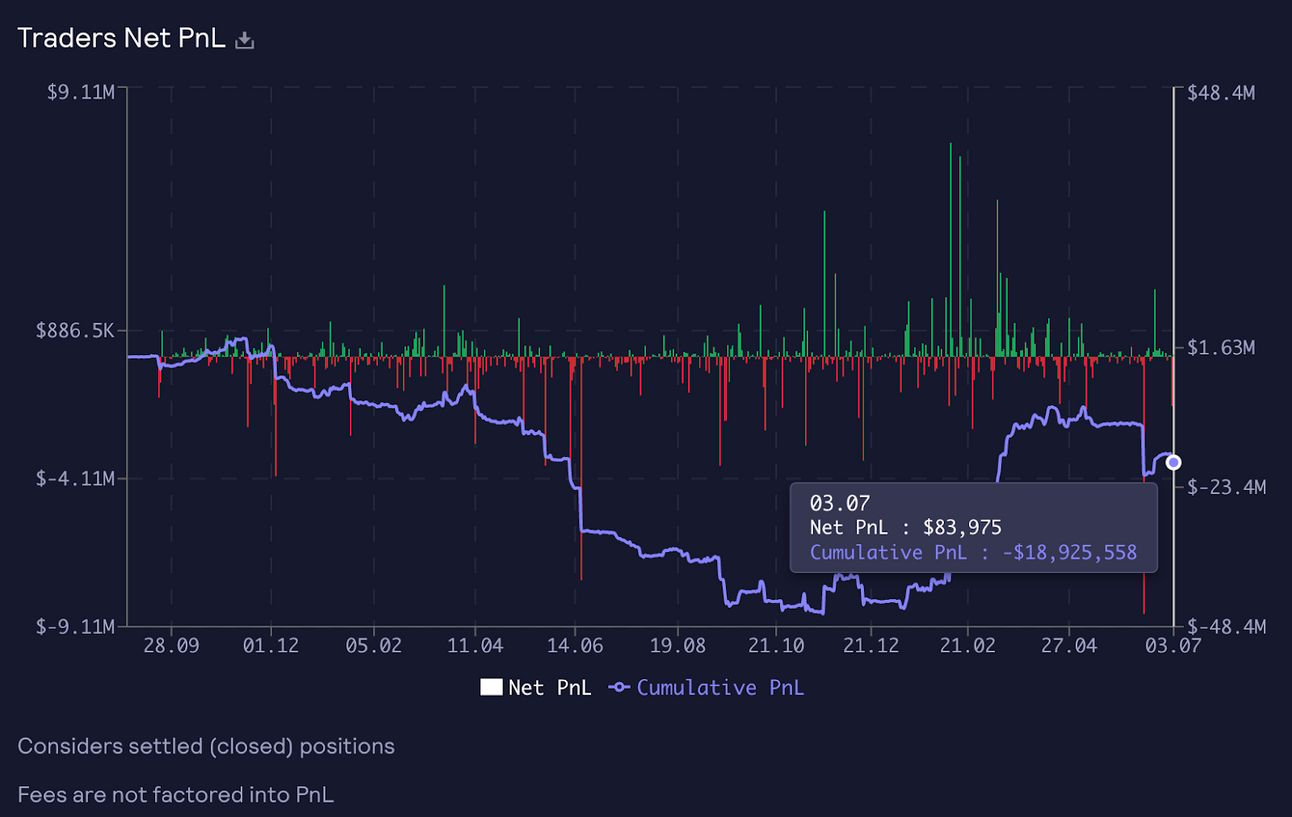
If you’ve ever been burned by unpredictable impermanent loss or wild swings in traditional LPs, GMX V2’s approach will feel like a breath of fresh air. The protocol uses adaptive funding rates to keep long and short open interest balanced. This mechanism automatically adjusts incentives so that neither side gets too crowded - protecting LPs from being overly exposed to trader PnL.
This equilibrium is key for anyone looking to maximize yield while minimizing risk in the SOL USDC pool on GMX. With current utilization rates hovering around 90%, fee generation stays robust even during sideways markets. It’s this smart design that has helped GM pools consistently outperform benchmark LP positions (read more here).
Diversification and Incentives: Boosting Your DeFi Yield Strategy
No savvy liquidity provider puts all their eggs in one basket - especially not when there are multiple high-performing pools available on Arbitrum! While the SOL/USD pool stands out for its current APY and TVL, diversifying across other pairs like ETH/USD or ARB/USD can help smooth out volatility-driven returns.
Top Strategies to Maximize GMX V2 Pool Returns
- Understand SOL/USD Pool Mechanics: The SOL/USD pool on GMX V2 pairs SOL (long token) with USDC (short token). LPs earn 63% of all trading and liquidation fees, with yields currently at 26.1% APY and a TVL of $7.9 million. Familiarize yourself with how fees and trader PnL impact your returns.

- Monitor Utilization Rates: High utilization (recently around 90%) signals active trading, which means more fees for LPs. Watch these rates to time your deposits for maximum fee generation.
- Leverage Adaptive Funding Rates: GMX V2 uses adaptive funding rates to keep long and short positions balanced. This reduces unpredictable swings in LP returns from trader PnL, helping you earn steadier yields.

- Diversify Across Multiple Pools: Spread your capital across pools like SOL/USD, ETH/USD, and ARB/USD to reduce exposure to a single asset’s volatility and potentially boost overall returns.

- Stay Informed on Incentive Programs: Watch for programs like the Arbitrum Short-Term Incentive Program (STIP), which have boosted yields for GMX LPs through ARB token rewards. These can significantly enhance your returns when active.

- Assess and Manage Risk Factors: Always consider risks such as smart contract vulnerabilities, trader PnL volatility, and token depegging. Use reputable analytics platforms and review official GMX documentation before depositing.
A bonus for active participants: Keep an eye out for incentive programs like the Arbitrum Short-Term Incentive Program (STIP), which has previously distributed ARB tokens to boost native yields for GM pools (details here). These initiatives can give your APR an extra kick beyond what fee earnings alone provide.
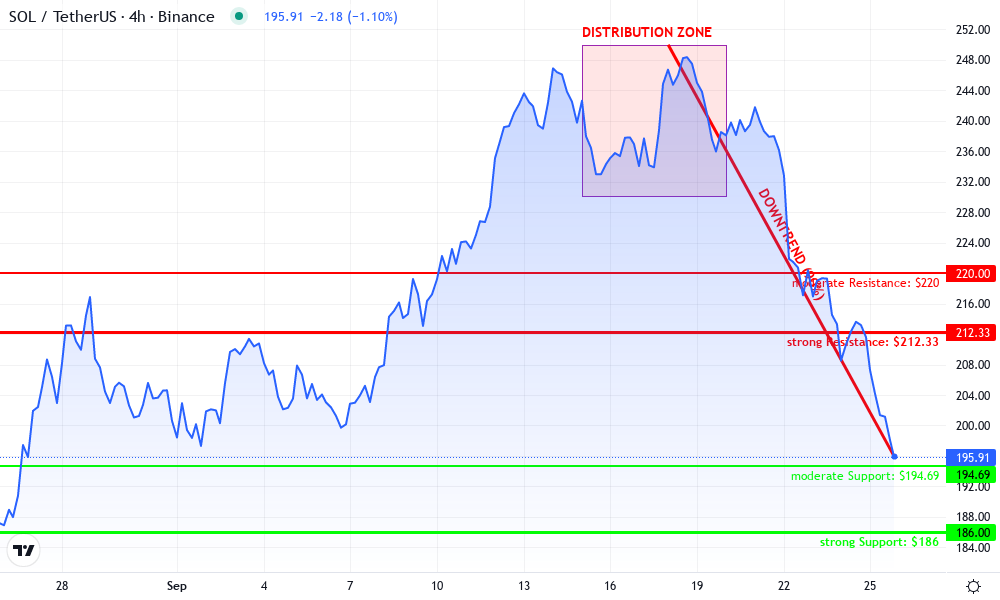
Solana Technical Analysis Chart
Analysis by Melissa Trent | Symbol: BINANCE:SOLUSDT | Interval: 4h | Drawings: 6
Technical Analysis Summary
Draw a major downtrend line from the recent high (~$250, 2025-09-18) down to the current price (~$196, 2025-09-25). Add horizontal support lines at $194.69 (recent low), $186 (psychological), and $212.33 (recent high and now resistance). Highlight the recent sharp sell-off zone with a rectangle between $220 and $196. Mark potential entry near $194.69 (support bounce) and exits near $212 (profit) or $186 (stop loss). Annotate with callouts noting the pronounced volume likely accompanying the breakdown, and MACD likely signaling bearish continuation.
Risk Assessment: medium
Analysis: While the sell-off has been aggressive, the fundamental DeFi context (strong GMX yields, stable TVL) provides some underlying support. However, the technical picture is clearly bearish until a reversal is confirmed. Swing entries here require tight risk management.
Melissa Trent's Recommendation: Wait for stabilization or a clear reversal signal at/below $194 before entering new longs. Aggressive traders may attempt a bounce trade with a stop below $186. Risk management is paramount—don't let research-backed setups become emotional trades.
Key Support & Resistance Levels
📈 Support Levels:
- $194.69 - Latest 24h low and immediate support; may offer a short-term bounce. moderate
- $186 - Psychological and visual support from prior lows seen on chart. strong
📉 Resistance Levels:
- $212.33 - Recent 24h high and now the next resistance to reclaim. strong
- $220 - Minor resistance from previous consolidation area. moderate
Trading Zones (medium risk tolerance)
🎯 Entry Zones:
- $194.69 - First test of immediate support post-selloff; potential for snapback rally. medium risk
🚪 Exit Zones:
- $212.33 - Take profit if price rebounds to reclaim broken support as resistance. 💰 profit target
- $186 - Stop loss beneath psychological support in case of further breakdown. 🛡️ stop loss
Technical Indicators Analysis
📊 Volume Analysis:
Pattern: Volume likely spiked during the breakdown as sellers accelerated.
Expect a notable volume spike on the way down, confirming capitulation.
📈 MACD Analysis:
Signal: Bearish
MACD likely confirms the bearish momentum, with signal line crossing down.
Applied TradingView Drawing Utilities
This chart analysis utilizes the following professional drawing tools:
Disclaimer: This technical analysis by Melissa Trent is for educational purposes only and should not be considered as financial advice. Trading involves risk, and you should always do your own research before making investment decisions. Past performance does not guarantee future results. The analysis reflects the author's personal methodology and risk tolerance (medium).
Solana (SOL) Price Prediction 2026-2031 (SOL/USD)
Professional outlook based on current market data, DeFi adoption trends, and GMX V2 pool performance on Arbitrum.
| Year | Minimum Price (Bearish) | Average Price (Base Case) | Maximum Price (Bullish) | % Change (Avg YoY) | Market Scenario Insights |
|---|---|---|---|---|---|
| 2026 | $170 | $240 | $320 | +22% | Post-2025 consolidation, steady DeFi adoption; regulatory clarity likely supports moderate growth |
| 2027 | $195 | $285 | $400 | +19% | Increased L2/DeFi TVL; new Solana upgrades; competition with ETH intensifies |
| 2028 | $225 | $340 | $480 | +19% | Mainstream DeFi usage, improved scalability; potential integration with TradFi |
| 2029 | $250 | $400 | $590 | +18% | Global regulatory frameworks mature; Solana ecosystem expands cross-chain |
| 2030 | $280 | $470 | $700 | +18% | Widespread institutional adoption; GMX V2 and similar products drive on-chain liquidity |
| 2031 | $315 | $530 | $820 | +13% | Market matures, volatility decreases; Solana holds top 5 market cap position |
Price Prediction Summary
Solana (SOL) is projected to maintain an upward trend through 2031, supported by robust DeFi activity, strong liquidity in GMX V2 pools, and ongoing network upgrades. Price growth may moderate as the market matures, but significant upside remains in bullish scenarios. Short-term volatility is likely, but long-term fundamentals are strong.
Key Factors Affecting Solana Price
- DeFi adoption rates, especially via protocols like GMX V2
- Solana's network upgrades and technical stability
- Regulatory developments in the US, EU, and Asia
- Competition from Ethereum, L2s, and alternative L1s
- Institutional adoption and TradFi integration
- Market cycles and macroeconomic conditions
- Potential for smart contract exploits or technical issues
Disclaimer: Cryptocurrency price predictions are speculative and based on current market analysis. Actual prices may vary significantly due to market volatility, regulatory changes, and other factors. Always do your own research before making investment decisions.
Staying nimble is crucial in the fast-moving world of Arbitrum DeFi yield farming. With the SOL/USD pool on GMX V2 maintaining a $7,900,000 TVL and a recent SOL price of $196.64, LPs have to constantly weigh risk, opportunity, and timing. The beauty of GMX’s model lies in its transparency: you can monitor utilization rates, fee accrual, and funding rate shifts in real-time to make informed decisions about when to add or remove liquidity.
Risk Management and Impermanent Loss: What Smart LPs Watch
Even with GMX’s innovative design, no yield opportunity comes without risk. The most pressing risks for SOL/USD LPs include:
- Smart contract vulnerabilities: While GMX V2 has undergone audits, DeFi always carries technical risk.
- Trader PnL impact: If one side (long or short) is heavily favored and traders win big, LPs can see reduced returns.
- Token depegging: USDC is generally stable but always monitor for market anomalies.
The adaptive funding rates help mitigate some of these issues by dynamically incentivizing balance between longs and shorts. Still, it’s wise to use portfolio management best practices like position sizing and periodic rebalancing. For more on how these mechanisms work under the hood, check out the official documentation (see details here).
Community Insights: What the Data-Driven Are Saying
The Arbitrum community has rallied around GMX as a core pillar of sustainable DeFi yield. Many seasoned LPs point out that the protocol’s ability to share 63% of all trading and liquidation fees with providers sets it apart from other platforms where yields are more dependent on inflationary token rewards. This real-yield approach means that as long as traders remain active - especially during volatile moves like SOL’s recent dip from $212.33 to $194.69 - fee generation remains robust.
If you’re looking to step up your game as an Arbitrum liquidity provider, consider using analytics dashboards that track net PnL exposure and utilization rates across all GM pools. These tools can help you identify when it might be time to rebalance or shift capital between pools for optimal APR.
Top Strategies to Maximize GMX V2 SOL/USD Pool Returns
- Understand Pool Mechanics: The SOL/USD pool on GMX V2 uses SOL as the long token and USDC as the short token. Liquidity providers (LPs) earn from trading, borrowing, and swap fees, with returns influenced by SOL's price and traders' net PnL. Knowing these dynamics helps you anticipate yield fluctuations.

- Monitor Utilization Rates: High utilization—recently around 90%—signals active trading, boosting fee generation and potential yields. Keep an eye on utilization stats to time your entries for optimal returns.
- Leverage Adaptive Funding Rates: GMX V2's adaptive funding rates help balance long and short open interest, smoothing out LP returns and reducing risk from trader PnL swings. This mechanism supports more predictable yields.
- Diversify Across Multiple Pools: Spreading your liquidity between SOL/USD and other pools like ETH/USD or ARB/USD can help manage risk and stabilize your overall returns, especially during volatile market periods.
- Stay Informed on Incentive Programs: GMX frequently offers programs like the Arbitrum Short-Term Incentive Program (STIP), which distributes ARB tokens to LPs and can significantly boost your yield. Follow GMX announcements to capitalize on these opportunities.

- Assess and Manage Risk: Attractive yields come with risks—smart contract vulnerabilities, trader PnL exposure, and potential USDC depegging. Always conduct due diligence and consider your risk tolerance before providing liquidity.
Looking Ahead: Sustaining High Yields in Changing Markets
The biggest question for any DeFi participant is how sustainable these yields are over time. As more users discover the advantages of isolated GM pools and adaptive funding rates, competition for top yields will likely increase - but so will TVL and trading activity. Staying informed about upcoming incentive programs (like past STIP allocations) is key since they can temporarily boost APR beyond base fee earnings (learn more here).
Pro tip: Use periods of heightened volatility (such as major news events impacting Solana) to your advantage by providing liquidity when trading volumes are highest - this is typically when fee accrual spikes.
Solana Technical Analysis Chart
Analysis by Melissa Trent | Symbol: BINANCE:SOLUSDT | Interval: 4h | Drawings: 5
Technical Analysis Summary
The chart shows that Solana (SOLUSDT) has experienced a sharp downtrend after peaking above $248 in mid-September 2025, falling rapidly to the current level near $196. This recent price action marks a significant breakdown from previous support zones and suggests ongoing bearish momentum. To represent this, draw a clear downtrend line from the most recent peak (around $248, September 18) to the current price. Mark recent horizontal support at $194 and a resistance zone near $212. Highlight the price range from $244 down to $196 as a distribution phase. Use a rectangle to mark the rapid decline area from $220 to $196. Place vertical lines for the breakdown event and annotate key price levels. Use text or callouts to highlight risk and potential bounce zones.
Risk Assessment:medium
Analysis:SOL is in a technical correction phase after a steep rally , with the current price testing a moderate support zone . While oversold bounces are possible , sustained recovery requires confirmation . Liquidity context from GMX and Arbitrum remains supportive , but short-term volatility is elevated due to recent DeFi exploits and liquidity shifts .
Melissa Trent's Recommendation:For active traders , consider quick bounce plays at support with tight stops , but be prepared for further volatility if $194 fails . Swing traders should wait for reversal confirmation above $212 before entering new longs . Maintain discipline—decisions backed by research , not rumors .
Key Support & Resistance Levels
📈 Support Levels:
- $194 - Immediate horizontal support from recent lows , just below the current price . A break here could escalate downside momentum . moderate
- $184 - Potential next support , based on previous local lows and psychological round number . weak
📉 Resistance Levels:
- $212 - Recent breakdown support turned resistance ; key level for any bullish reversal attempts . moderate
- $220 - Minor resistance within the recent distribution range , could cap any short-term recovery . weak
Trading Zones (medium risk tolerance)
🎯 Entry Zones:
- $196 - Potential bounce play off oversold conditions near the support zone , but only with confirmation from reversal candles/volume.medium risk
- $194 - Aggressive entry for reversal traders if support holds , ideally with tight stops.high risk
🚪 Exit Zones:
- $212 - Take profit for short-term bounce trades ; serves as immediate resistance.💰 profit target
- $192 - Stop loss trigger if price fails to hold above support and accelerates downward.🛡️ stop loss
Solana (SOL) Price Prediction 2026-2031 (SOL/USD)
Professional Outlook Based on Market Trends, GMX V2 Pool Performance, and Industry Factors
| Year | Minimum Price | Average Price | Maximum Price | Year-over-Year % Change (Avg) | Market Scenario Insights |
|---|---|---|---|---|---|
| 2026 | $180.00 | $230.00 | $295.00 | +17% | Continued strong DeFi and liquidity pool adoption; mild regulatory headwinds |
| 2027 | $210.00 | $285.00 | $370.00 | +24% | Bullish scenario: Layer 2 scaling and new use cases drive adoption; bearish: macro tightening |
| 2028 | $245.00 | $350.00 | $450.00 | +23% | Solana ecosystem matures; new protocol upgrades; competition from other L1s intensifies |
| 2029 | $275.00 | $410.00 | $520.00 | +17% | Wider institutional adoption; potential regulatory clarity; DeFi TVL growth |
| 2030 | $320.00 | $470.00 | $605.00 | +15% | Global crypto integration, improved scalability; possible ETF products |
| 2031 | $360.00 | $520.00 | $700.00 | +11% | Solana firmly established as leading smart contract platform; mainstream developer adoption |
Price Prediction Summary
Solana (SOL) is expected to maintain a strong upward trajectory over the next six years, driven by its robust DeFi ecosystem, high-yield liquidity pools like GMX V2 on Arbitrum, and ongoing technological improvements. While the market will likely experience periods of volatility and regulatory uncertainty, the average price is projected to rise steadily, with potential for significant upside in bullish scenarios. Minimum price projections reflect possible pullbacks during bearish periods or broader market corrections, while maximum prices account for accelerated adoption and favorable macro conditions.
Key Factors Affecting Solana Price
- Performance and adoption of GMX V2 and similar DeFi protocols on Arbitrum
- Solana's ongoing scalability upgrades and ecosystem expansion
- General crypto market cycles, including potential bull and bear phases
- Regulatory developments in the US, EU, and major Asian markets
- Competition from other Layer 1 and Layer 2 blockchains
- Macro-economic factors such as global liquidity, interest rates, and institutional participation
- Security events (e.g., exploits, smart contract risks) impacting confidence and TVL
Disclaimer: Cryptocurrency price predictions are speculative and based on current market analysis. Actual prices may vary significantly due to market volatility, regulatory changes, and other factors. Always do your own research before making investment decisions.
The bottom line? With careful monitoring, a diversified approach across multiple pools, and attention to evolving incentive structures, LPs can unlock some of the highest real yields available on Arbitrum right now via GMX V2’s SOL/USD pool. As always in DeFi: decisions backed by research - not rumors - will keep you ahead of the curve.
Tags
Related Articles
GMX Arbitrum GLP Pool Strategies for Maximum Yield in 2026
GMX's Arbitrum GLP pools continue to anchor DeFi yield strategies in 2026, even as V2 introduces specialized GM pools. With GMX at $6.71 today, up $0.35 or 0.0550% over the past 24 hours, hitting a high of $6.78 and low of $6.36, liquidity...
Apr 22, 2026
Arbitrum ETH/ARB Liquidity Pool Yield Farming: Unlocking 300%+ APYs on Volatile Pairs
In the pulsating heart of Arbitrum's DeFi ecosystem, the ETH/ARB liquidity pool stands out as a beacon for yield farmers chasing triple-digit returns. With ARB trading at $0.0956 after a 24h dip of -3.97%, volatility remains the name of...
Mar 8, 2026
Arbitrum Stablecoin Yield Farms 11-15% APY Low Impermanent Loss Strategies 2026
In 2026, whispers of yield farming's demise have faded as Arbitrum's DeFi ecosystem delivers steady stablecoin yield Arbitrum opportunities at 11-15% APY, all while slashing impermanent loss to negligible levels. Reddit threads echo this...
Mar 4, 2026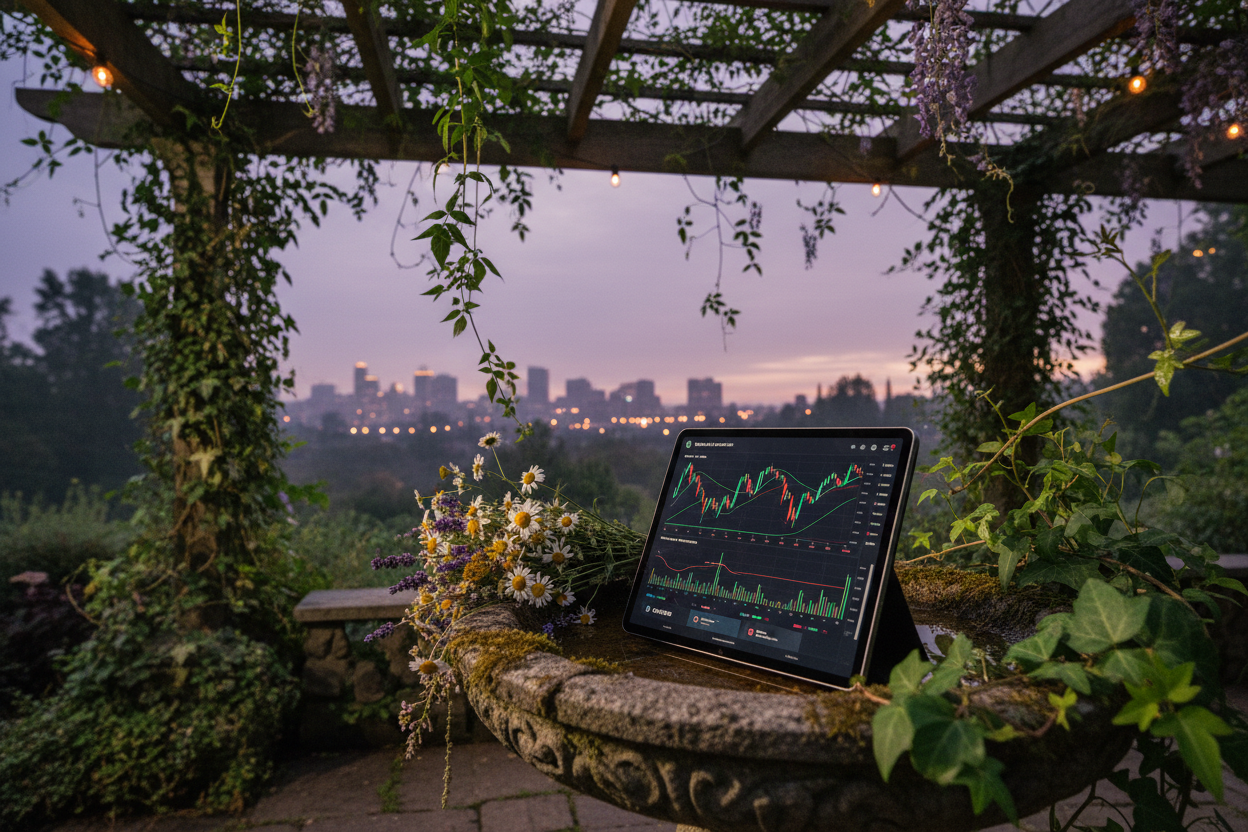
GMX Arbitrum Perps Trading: Low Fee Strategies for Liquidity Providers 2026
In the fast-paced world of Arbitrum DeFi, GMX Arbitrum trading continues to shine as a beacon for liquidity providers chasing sustainable yields amid volatile markets. With GMX trading at $6.31 as of February 24,2026 - up $0.10 or and...
Feb 24, 2026
No comments yet. Be the first to share your thoughts!